Cities occupy little more than two per cent of the land surface and account for most of the energy consumption and emissions associated with transport, buildings and consumption. They are also where climate change is felt first and hardest: heat amplifies among the asphalt, water finds nowhere to soak away, and a heatwave kills more people in a city than in the countryside.
This guide separates the two tasks usually conflated, mitigation and adaptation, explains the specific risks a city faces, reviews the measures with evidence behind them and those that are mostly communication, and identifies who suffers each impact first, which is almost never whoever decides.
Mitigation and adaptation are not the same
To mitigate is to cut emissions so the problem does not get worse: fewer cars, buildings that use less, clean electricity, less waste. To adapt is to prepare the city for what is coming even if emissions stopped tomorrow: shade, water, drainage, refuges, warning systems.
The distinction matters because the timescales and the beneficiaries differ. Mitigation is global and deferred: what Bilbao stops emitting benefits the planet decades from now. Adaptation is local and immediate: the shade planted today saves lives in next August's heatwave, on that street and not another.
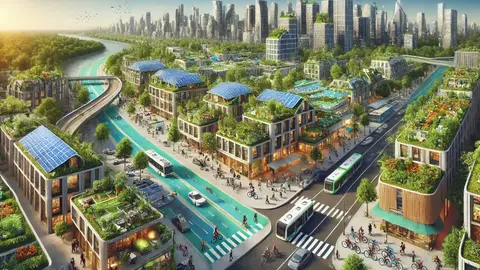
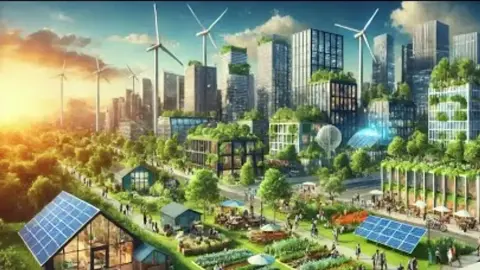
Good measures usually do both, and that is the practical test for prioritising. A large tree gives shade, absorbs rainwater and stores carbon. A street with fewer cars cuts emissions and also lowers the temperature of the asphalt. Retrofitting a building cuts bills, cuts emissions and stops its residents overheating. When a measure only does one of the two, it is worth knowing.
The heat island: why the city burns
A city can be several degrees hotter than its rural surroundings, and the gap widens at night, which is when it matters. The cause is physical: urban materials — asphalt, concrete, tile — absorb radiation during the day and release it slowly at night; street geometry traps that heat between façades; there is not enough vegetation to cool by evapotranspiration; and waste heat from traffic and air conditioning is added on top.
The health effect is the deadliest of all urban climate impacts. What kills in a heatwave is less the midday peak than the tropical night: if the temperature does not drop below twenty or twenty-five degrees, the body does not recover, and mortality rises sharply from the third consecutive day. The victims are mostly older people living alone, in uninsulated flats and on upper floors.
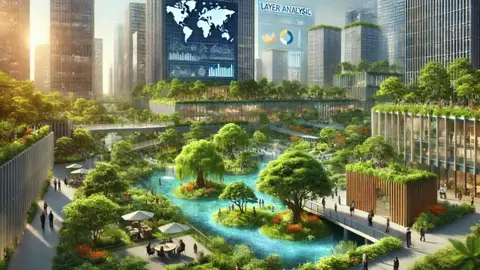
What works is well established: broad-crowned street trees over pavements, the most effective measure per euro invested; light-coloured permeable surfaces instead of black asphalt; water at the surface; ventilation corridors kept clear of building; and climate refuges within walking distance, with extended opening hours and clear signage. Awnings and pergolas work where a tree will not fit, but they do not replace evapotranspiration.
Water: too much, too fast
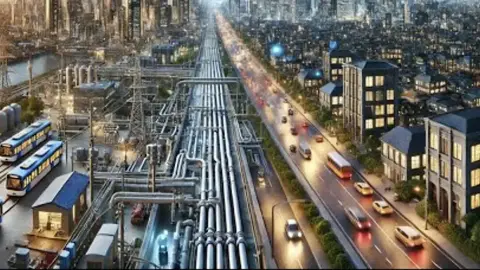
The problem with urban flooding is rarely that total rainfall has risen; it is that a lot of rain falls in a short time onto an impermeable surface. Natural ground infiltrates most rainfall; a conventional city sends almost all of it to a sewer network sized for a different climate and a smaller built area.
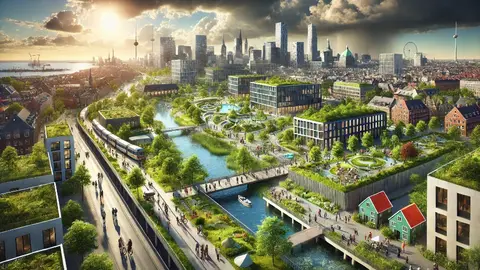
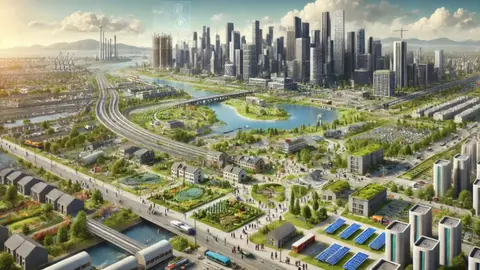
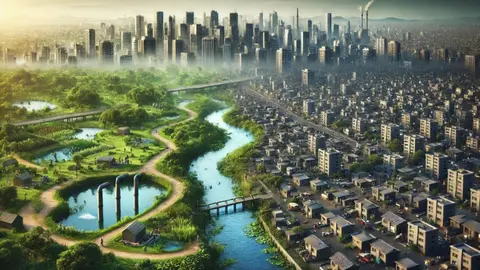
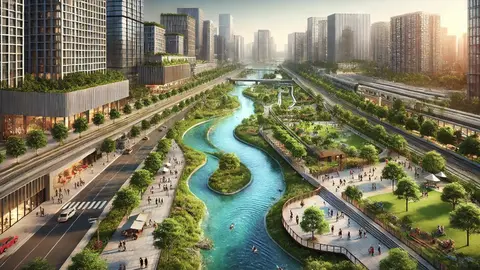
The response proven to work is sustainable urban drainage: permeable paving, continuous tree pits that take runoff from the carriageway, rain gardens, swales, storm tanks and the daylighting of culverted streams. The central idea is to retain and delay rather than evacuate fast, because the problem is peak flow. Copenhagen, after the 2011 flood, has built a full programme of streets and squares designed to flood on purpose so that homes do not.
There is also a prior planning problem: much of the damage happens on land that should never have been developed, in floodplains and over culverted watercourses. The cheapest and most unpopular measure is not to build there, and the second is to stop assuming that a risk map drawn thirty years ago still holds.
Buildings: where most of the saving is
In European cities, heating, cooling and hot water in buildings account for an enormous share of energy use, and most of the buildings that will be standing in 2050 already exist. That means the bulk of the work is not in new construction, however efficient, but in retrofitting what is already there.
The order of effectiveness is well documented: first the envelope — wall, roof and window insulation — because it cuts demand permanently; then ventilation with heat recovery; then replacing gas boilers with heat pumps; and last, renewable generation on the roof. Doing it in reverse, putting panels on an uninsulated building, produces worse results per euro.
The obstacle is usually not technical but distributive. In a block of flats a whole community has to agree, and a landlord will not invest in an improvement the tenant enjoys, while the tenant cannot invest in what is not theirs. The programmes that work solve exactly that: a single point of contact, financing repaid out of the savings, larger grants for low incomes, and technical support throughout the works.
Who suffers first
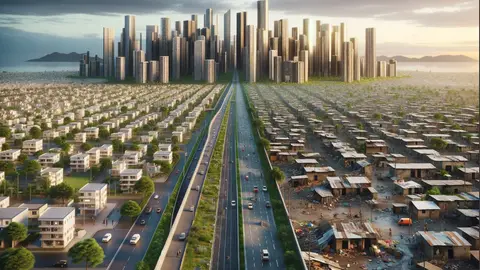
Urban climate impacts are distributed along the map of inequality. The districts with fewest trees, most asphalt and worst-insulated housing are systematically the lowest-income ones, and that pattern has been measured in dozens of cities. The same heatwave produces very different mortality ten minutes apart.
On top of exposure comes the capacity to respond. Those with air conditioning, a second home, a car and home insurance get through the episode uncomfortably; those without get through it at risk. And energy poverty adds another turn of the screw: households that do not switch on the cooling they have because they cannot pay the bill.
Adaptation therefore has to prioritise geographically rather than spread resources evenly. The plans that work start by overlaying the surface temperature map with income and with the age of the population, and act first where all three coincide. It is less photogenic than a big new park, and it saves more lives.
What works and what is mostly narrative
With solid evidence behind them: trees and shade, envelope retrofit, reducing motor traffic, sustainable drainage, heatwave warning systems with a protocol for visiting vulnerable people, and not developing floodplains. These are unspectacular measures with measurable results.
With weaker evidence than claimed: carbon offsets, whose additionality is hard to verify; neutrality targets for a distant year with no interim carbon budget; isolated green walls and roofs, which are expensive, need irrigation and maintenance and mostly cool the building itself; and certified flagship buildings promoted as transforming a whole district.
A useful test is to ask three things: does the measure have a measurable indicator and a near-term date? Is the budget assigned or is it a declaration? Who maintains it in five years' time? A tree with no line item for watering and pruning is a photograph, not a policy.
How to read a city's climate plan
The first thing is to check whether there is an up-to-date emissions inventory and what it covers: only the municipality's direct emissions, or electricity and consumption too. Many plans look excellent because they leave out what matters, and a city measuring only what burns inside its boundaries can declare itself clean while consuming steel, cement and flights.
Next, look for interim targets, at two and five years, with a named owner and a budget, rather than a single 2050 goal no current officeholder will ever answer for. And check whether the adaptation plan rests on a real vulnerability map, with temperature, income and age data, or on a general description of risks.
The last check is coherence. A climate plan often coexists with a land use plan allowing growth on the periphery, a mobility plan adding road capacity and a budget still funding parking. When that happens, the climate document is not the city's policy: it is its communications.
Frequently asked questions
- What is the difference between mitigation and adaptation?
- Mitigation is cutting emissions so the problem does not worsen; adaptation is preparing the city for impacts that are already unavoidable. Mitigation acts globally and over the long term, adaptation locally and immediately. The best measures do both.
- What is the urban heat island?
- The temperature difference between a city and its rural surroundings, caused by heat-absorbing materials, street geometry, lack of vegetation and waste heat from traffic and cooling. It is most pronounced at night, which is when it becomes dangerous.
- What is the most effective adaptation measure?
- Broad-crowned street trees over pavements. They give shade, cool by evapotranspiration, absorb rainwater and store carbon, and deliver the best result per euro invested, provided watering and pruning are guaranteed over the long term.
- Where do you start when retrofitting a building?
- With the envelope: wall, roof and window insulation, because it cuts demand permanently. Then ventilation with heat recovery, then a heat pump instead of a gas boiler, and only last renewables on the roof.
- How do I know if my city's climate plan is serious?
- Check three things: that the emissions inventory includes electricity and consumption and not only what burns within the municipality; that there are two and five year targets with assigned budgets; and that the land use and mobility plans do not contradict the climate one.